Why Kingsford Hillview Peak Underperformed—Despite Its MRT Location And “Good” Entry Price

In this Stacked Pro breakdown:
Why ROI Alone Doesn’t Tell the Full Story: Kingsford Hillview Peak Case Study
Comparison
We tracked Kingsford Hillview Peak’s performance from launch in 2013 through to 2024, and benchmarked it against nearby Hillview condos, other district 23 leasehold projects, and similarly launched developments like Sky Vue and Thomson Three.
Key Insight
Despite its MRT proximity and seemingly attractive entry prices, Kingsford Hillview Peak delivered the weakest annualised growth among its peers, even trailing older freehold neighbours and other 99-year leasehold projects launched during the same market cycle.
Why This Matters
ROI figures may look simple, but they don’t account for resale timing, buyer sentiment, unit mix, or design mismatches. Kingsford Hillview Peak highlights how qualitative factors – from layout preferences to build perception – can heavily shape long-term outcomes, even when launch conditions seem favourable.
🔓 Read the full analysis — only on Stacked Pro.
Already a subscriber? Log in here.
Most condos are already profitable after completion, for those who bought earlier in developer sales. However, Kingsford Hillview is one of the more curious cases. Launched in 2013, this leasehold condo in the Hillview area seemed well-positioned: close to an MRT station, relatively affordable pricing, and other good markers. Yet over a decade later, it has significantly underperformed in both capital appreciation and resale profitability. Rather than take the somewhat simplistic view of just calling it “bad,” let’s go beyond ROI and see what the real issues were – and whether they are issues which can in fact be rectified.
In this Stacked Pro case study, we examine why the project’s price trajectory faltered, how developer sales shaped its long-term performance, and what ROI alone doesn’t reveal about its performance.
A brief profile of Kingsford Hillview Peak
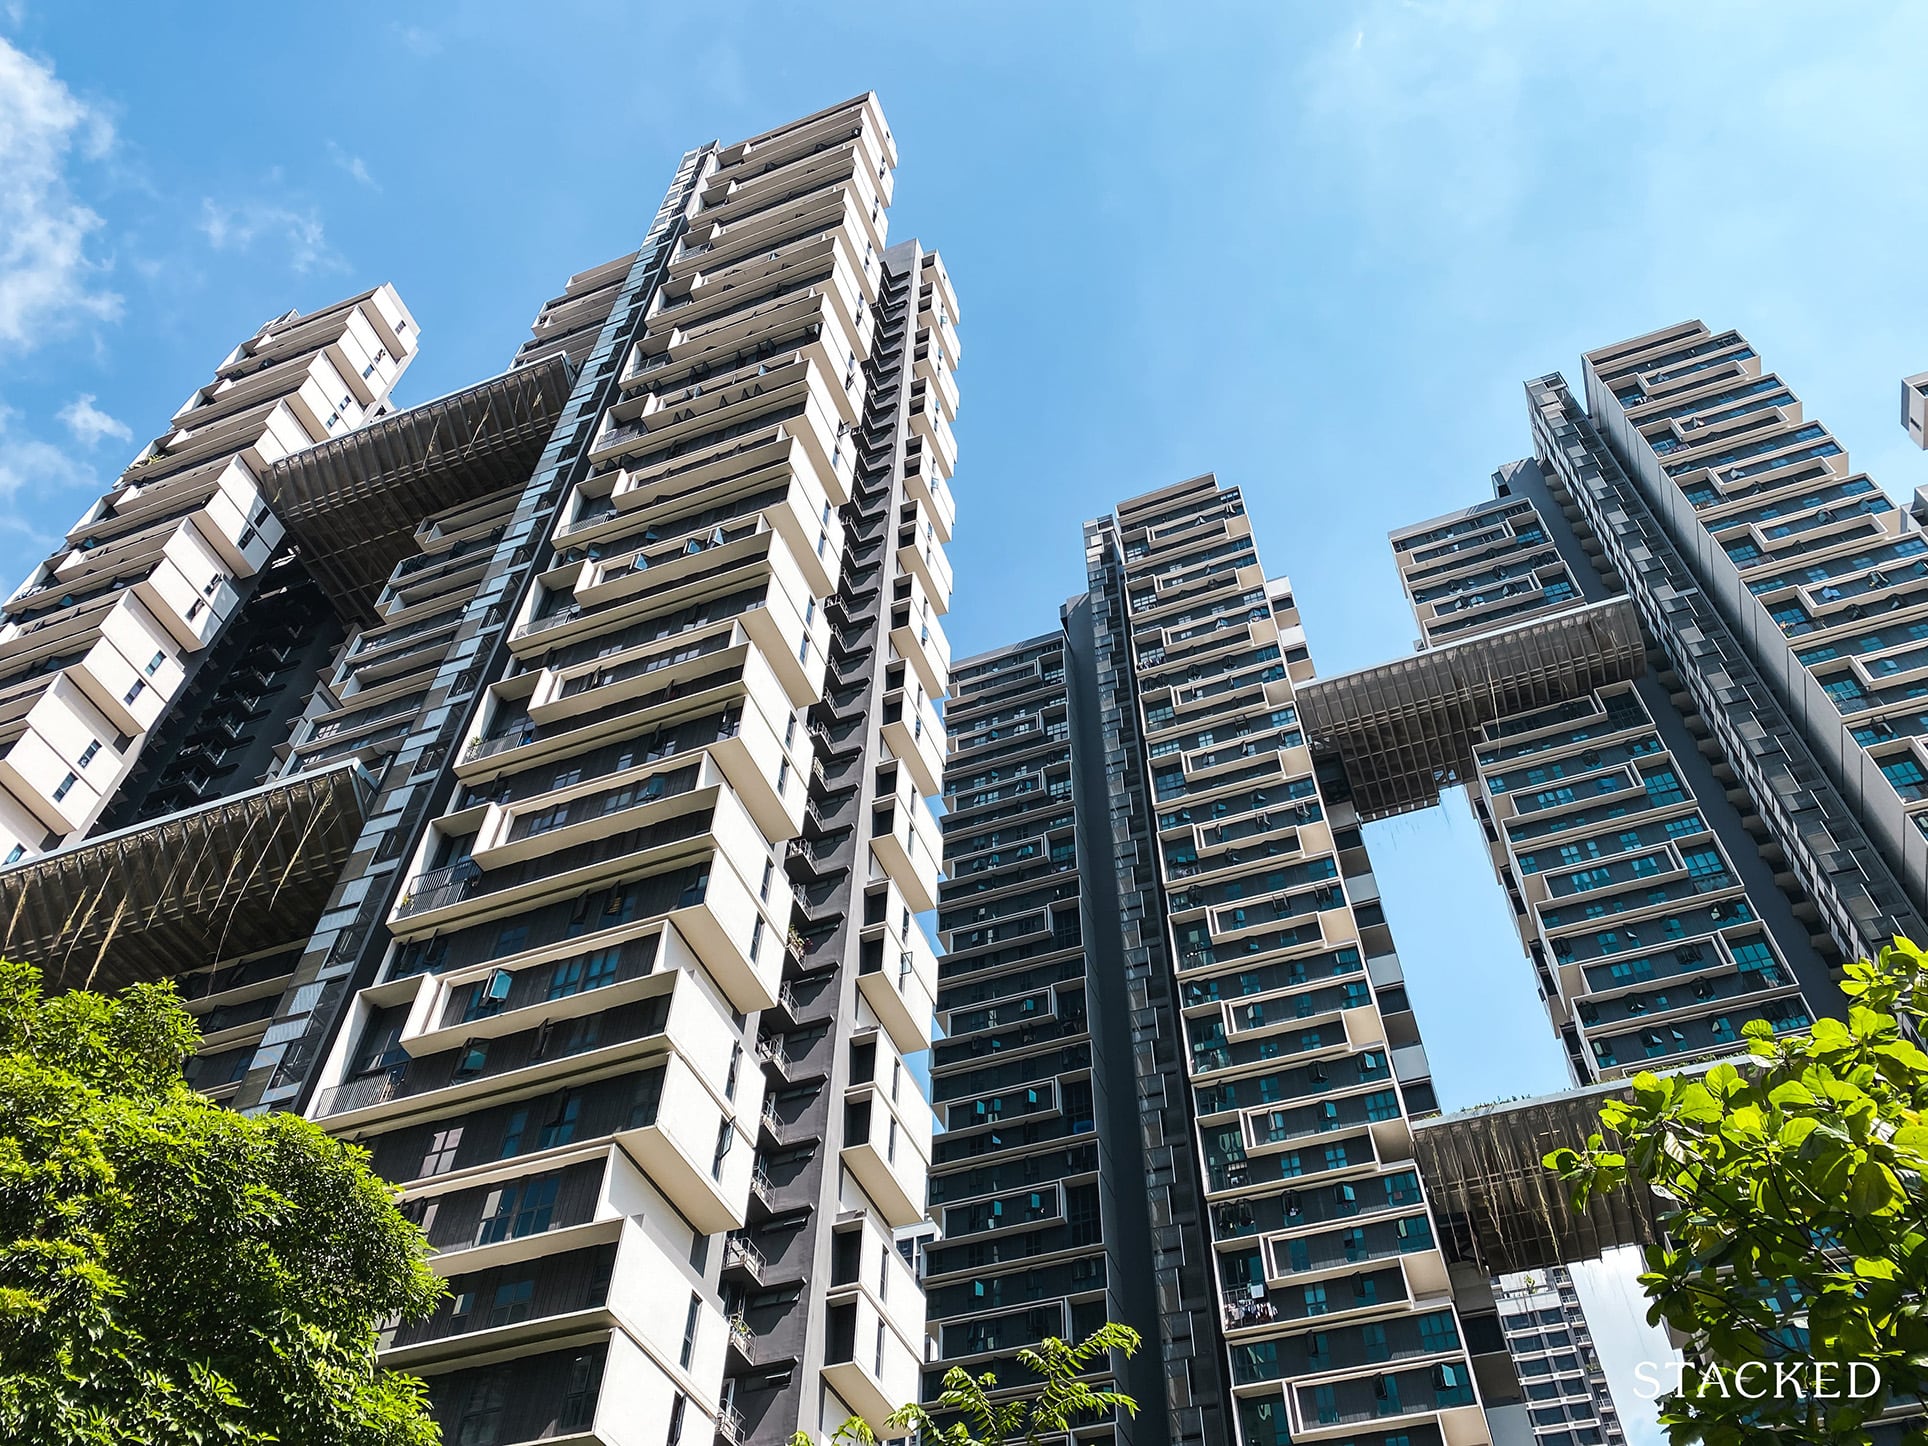
Kingsford Hillview Peak is a 99-year leasehold condo located in the Hillview area, just a short walk from Hillview MRT station (DTL). Completed in 2017, the project comprises 512 units across three blocks, including a surprising number of compact one-bedroom layouts and several penthouses with large roof terraces.
Launched in 2013, the development offered relatively affordable pricing at the time, with high ceilings and full condo facilities like a sky tennis court, lap pool, and floating gym. While it has good proximity to the MRT and HillV2 mall, Kingsford Hillview Peak has competition in that it has nearby freehold neighbours.
Let’s look at the overall performance of Kingsford Hillview Peak from its launch

| Year | Average $PSF |
| 2013 | $1,349 |
| 2014 | $1,394 |
| 2015 | $1,303 |
| 2016 | $1,281 |
| 2017 | $1,044 |
| 2018 | $1,365 |
| 2019 | $1,373 |
| 2020 | $1,273 |
| 2021 | $1,292 |
| 2022 | $1,356 |
| 2023 | $1,342 |
| 2024 | $1,412 |
| Annualised | 0.42% |
From launch in 2013 to 2024, Kingsford Hillview Peak saw very weak gains: we see its average $PSF increasing from $1,349 to $1,412, translating to an annualised growth of just 0.42 per cent.
This is a significant divergence from the performance seen in most new launches, where prices generally rise much higher over time. One of the reasons is that its price momentum faltered early: following a noticeable lull in transactions in mid-2015, the developer cut prices by approximately 20 to 22 per cent to revive sales.
This move was prompted by slow take-up rates. This is because the project launched in 2013, under the weight of property cooling measures. Then in 2015, primary sales across the sector continued to weaken, with buyers holding off for better pricing.
A second sharp dip appears to have occurred in 2017. According to agents on the ground however, this apparent “dip” was really just due to a cluster of penthouse transactions with large roof terraces, which lowered the average $PSF. This distorted overall pricing data for the period.
(This is because layouts with a lot of outdoor space, such as roof terraces, tend to price the outdoor portions cheaper.)
As such, we already see how oversimplified ROI distorts the picture: the weaker performance was heavily affected by developer launch pricing and the nature of the units.
That alone didn’t tell us much, so let’s try to get a clearer look at Kingsford Hillview’s performance via making relevant comparisons.
We’ll start by measuring its performance against the overall market, and then against other projects in district 23. We’ll also keep our comparison to other leasehold condos, to ensure a fair comparison.

| Year | Kingsford Hillview Peak | D23 condos | All 99-year LH condos |
| 2013 | $1,349 | $1,142 | $1,163 |
| 2014 | $1,394 | $1,040 | $1,195 |
| 2015 | $1,303 | $949 | $1,104 |
| 2016 | $1,281 | $908 | $1,166 |
| 2017 | $1,044 | $941 | $1,230 |
| 2018 | $1,365 | $965 | $1,359 |
| 2019 | $1,373 | $1,032 | $1,474 |
| 2020 | $1,273 | $1,056 | $1,453 |
| 2021 | $1,292 | $1,286 | $1,517 |
| 2022 | $1,356 | $1,246 | $1,595 |
| 2023 | $1,342 | $1,530 | $1,783 |
| 2024 | $1,412 | $1,594 | $1,854 |
| Annualised | 0.42% | 3.08% | 4.33% |
From 2013 to 2024, Kingsford Hillview Peak’s annualised growth of 0.42 per cent significantly trailed district 23 leasehold condos, which averaged 3.08 per cent, and the island-wide average of 4.33 per cent.
In the early years, prices at Kingsford Hillview Peak were roughly in line with the overall district averages. But from 2016 onward, when the broader market began recovering, Kingsford Hillview remained mostly stagnant. From the table above, we can see the project saw only a mild uptick in 2023 and 2024, long after other developments had already posted strong growth.
Even if we exclude the 2017 dip (likely affected by penthouse unit sales), the gap between Kingsford Hillview Peak and its peers has continued to widen over time.
However, we need to remember the distortions during developer sales – such as developer discounts – that are affecting the overall results.
One simple way to get around this is to look only at resale transactions. This will exclude developer pricing issues, and show us Kingsford Hillview’s real performance in the secondary or “true” market:
| Year | Kingsford Hillview Peak | D23 condos | All 99-year LH condos |
| 2020 | $1,273 | $963 | $1,148 |
| 2021 | $1,292 | $1,045 | $1,207 |
| 2022 | $1,356 | $1,160 | $1,337 |
| 2023 | $1,342 | $1,311 | $1,465 |
| 2024 | $1,412 | $1,355 | $1,574 |
| Annualised | 2.62% | 8.91% | 8.22% |
Unfortunately, Kingsford Hillview continues to trail the market, even when we exclude the developer sale issues. From 2020 to 2024, resale prices at Kingsford Hillview Peak rose at an annualised rate of 2.62 per cent, which is still significantly lower than district 23 leasehold resale condos (8.91 per cent) and the overall leasehold market (8.22 per cent.)
While the absolute $PSF may appear healthy, this slower growth still indicates weaker resale momentum.
Perhaps we’ll see something different, if we compare it to neighbouring developments instead.
Kingsford Hillview’s closest projects include three other leasehold and three freehold condos:
| Project | Hillview Park | Hillview Heights | Glendale Park | The Hillier | Kingsford Hillview Peak | Midwood |
| Tenure | Freehold | Freehold | Freehold | 99-years | 99-years | 99-years |
| Launch year | – | 1993 | 1996 | 2012 | 2013 | 2019 |
| Completion year | 1995 | 1996 | 2000 | 2016 | 2017 | 2023 |
| No. of units | 184 | 360 | 448 | 528 | 512 | 564 |
Since we only have transaction data from 1995 onwards, we will not be able to look at the performance of the older projects from their launch date. So for this next portion, we will just look at Glendale Park, The Hillier and Midwood:
| Year | Glendale Park | The Hillier | Kingsford Hillview Peak | Midwood |
| 1996 | $749 | |||
| 1997 | $729 | |||
| 1998 | $596 | |||
| 1999 | $616 | |||
| 2000 | $676 | |||
| 2001 | $610 | |||
| 2002 | $571 | |||
| 2003 | $528 | |||
| 2004 | $452 | |||
| 2005 | $456 | |||
| 2006 | $439 | |||
| 2007 | $566 | |||
| 2008 | $619 | |||
| 2009 | $671 | |||
| 2010 | $782 | |||
| 2011 | $917 | |||
| 2012 | $983 | 1,342 | ||
| 2013 | $1,086 | 1,459 | $1,349 | |
| 2014 | $1,004 | 1,253 | $1,394 | |
| 2015 | $995 | 1,360 | $1,303 | |
| 2016 | $978 | 1,316 | $1,281 | |
| 2017 | $1,033 | 1,303 | $1,044 | |
| 2018 | $1,161 | 1,358 | $1,365 | |
| 2019 | $1,203 | 1,386 | $1,373 | $1,643 |
| 2020 | $1,197 | 1,352 | $1,273 | $1,626 |
| 2021 | $1,337 | 1,424 | $1,292 | $1,685 |
| 2022 | $1,469 | 1,488 | $1,356 | $1,712 |
| 2023 | $1,533 | 1,550 | $1,342 | $2,026 |
| 2024 | $1,634 | 1,583 | $1,412 | $1,922 |
| Annualised | 2.83% | 1.38% | 0.42% | 3.19% |
When we look at individual annualised price growth since launch, Kingsford Hillview Peak ranks last among neighbouring projects.
Despite being newer and having modern facilities, it was outpaced by older freehold condos like Glendale Park, Hillview Heights, and Hillview Park; as well as by The Hillier, another 99-year leasehold project. Even Midwood, which only recently saw its first resale transaction, has shown stronger pricing momentum based on initial new sale data!
This is due to a number of qualitative factors. The first is the rocky start that Kingsford Hillview experienced: not simply the developer having to drop prices (which can already affect perceptions of quality) but actual quality complaints that made their way into mainstream media. Poor finishing was one of the cited issues. This was compounded by the developer running into the government’s bad side: there were repeated safety lapses during construction, and queries about the actual unit sizes versus the plans submitted.
The problems at Kingsford Hillview were serious enough that it impacted subsequent projects like Normanton Park, which were issued with a no-sale license (i.e., the government didn’t allow sales to begin until it inspected every unit to its satisfaction.)
Even though the developer did rectify the issues, and we’ve heard no subsequent complaints, existing reports can influence buyer decisions. Even if you were to Google Kingsford Hillview Peak today – as buyers are apt to do – it’s likely that some of these old problems will surface.
Second, this project is a leasehold project with freehold neighbours, which causes Kingsford Hillview Peak to suffer by contrast. Again though, to be fair, we’ll also look at only resale transaction between Kingsford Hillview and its neighbours
This is once again to exclude any issues from its developer launch pricing. Note that Midwood only saw its first resale transaction in 2024, so we will not include it here:
| Year | Hillview Park | Hillview Heights | Glendale Park | The Hillier | Kingsford Hillview Peak |
| 2020 | $1,163 | $1,250 | $1,197 | $1,352 | $1,273 |
| 2021 | $1,221 | $1,335 | $1,337 | $1,424 | $1,292 |
| 2022 | $1,419 | $1,481 | $1,469 | $1,488 | $1,356 |
| 2023 | $1,450 | $1,609 | $1,533 | $1,550 | $1,342 |
| 2024 | $1,537 | $1,699 | $1,634 | $1,583 | $1,412 |
| Annualised | 7.22% | 7.97% | 8.09% | 4.02% | 2.62% |
Even when measured only from 2020, Kingsford Hillview Peak comes in last in terms of resale price growth. From the table above, older freehold condos like Hillview Heights and Glendale Park not only recorded higher $PSF each year, but also delivered more than triple the growth rate.
The Hillier, a more direct leasehold comparison, still outperformed it with around four per cent annualised growth. So unfortunately, Kingsford’s slower price movement remains a clear fact.
Let’s also look at how Kingsford Hillview Peak has performed against other condos launched in the same year
| Project | Alex Residences | Duo Residences | Kingsford Hillview Peak | Sky Vue | The Glades | Thomson Three |
| Tenure | 99-year | 99-year | 99-year | 99-year | 99-year | 99-year |
| District | 3 | 7 | 23 | 20 | 16 | 20 |
| No. of units | 429 | 660 | 512 | 694 | 726 | 435 |
| Completion year | 2017 | 2017 | 2017 | 2016 | 2016 | 2016 |
| Year | Alex Residences | Duo Residences | Kingsford Hillview Peak | Sky Vue | The Glades | Thomson Three |
| 2013 | $1,697 | $1,993 | $1,349 | $1,432 | $1,474 | $1,364 |
| 2014 | $1,689 | $2,307 | $1,394 | $1,529 | $1,457 | $1,340 |
| 2015 | $1,743 | $2,144 | $1,303 | $1,539 | $1,427 | $1,325 |
| 2016 | $1,949 | $2,272 | $1,281 | $1,634 | $1,409 | $1,398 |
| 2017 | $1,956 | $2,150 | $1,057 | $1,623 | $1,450 | $1,479 |
| 2018 | $1,908 | $2,188 | $1,365 | $1,641 | $1,422 | $1,540 |
| 2019 | $1,812 | $2,228 | $1,373 | $1,734 | $1,481 | $1,516 |
| 2020 | $1,811 | $1,982 | $1,273 | $1,670 | $1,433 | $1,505 |
| 2021 | $1,909 | $2,138 | $1,292 | $1,766 | $1,463 | $1,625 |
| 2022 | $1,979 | $2,165 | $1,356 | $1,874 | $1,530 | $1,727 |
| 2023 | $2,079 | $2,203 | $1,342 | $1,998 | $1,637 | $1,879 |
| 2024 | $2,152 | $2,169 | $1,412 | $2,123 | $1,710 | $2,034 |
| Annualised | 2.18% | 0.77% | 0.42% | 3.64% | 1.36% | 3.70% |
Among the six, Thomson Three and Sky Vue stood out as the strongest performers, with steady appreciation rates of 3.70 per cent and 3.64 per cent respectively. Despite launching during the onset of cooling measures in 2013, both projects managed consistent growth through the decade, thanks to strong locations, good layouts, and broad buyer appeal.
Kingsford Hillview Peak, by contrast, came in last with just 0.42 per cent growth. Even among peers launched during the same market conditions, its pricing has remained largely stagnant.
How much has the freehold / leasehold status affected the performance?
Let’s look at the records of profitability to see how this had an effect:
Hillview Park
| Profitable transactions | ||||
| Average gains | Average purchase price | Average ROI | Average holding period (years) | No. of tnx |
| $748,783 | $824,777 | 90.79% | 15.7 | 23 |
Hillview Heights
| Profitable transactions | ||||
| Average gains | Average purchase price | Average ROI | Average holding period (years) | No. of tnx |
| $728,737 | $911,180 | 79.98% | 15.6 | 33 |
Glendale Park
| Profitable transactions | ||||
| Average gains | Average purchase price | Average ROI | Average holding period (years) | No. of tnx |
| 855,864 | $979,998 | 87.33% | 15.4 | 60 |
The Hillier
| Profitable transactions | Unprofitable transactions | ||||||||
| Average gains | Average purchase price | Average ROI | Average holding period (years) | No. of tnx | Average losses | Average purchase price | Average ROI | Average holding period (years) | No. of tnx |
| $113,999 | $867,589 | 13.14% | 9.1 | 122 | -$64,582 | $1,062,041 | -6.08% | 8.3 | 22 |
Kingsford Hillview Peak
| Profitable transactions | Unprofitable transactions | ||||||||
| Average gains | Average purchase price | Average ROI | Average holding period (years) | No. of tnx | Average losses | Average purchase price | Average ROI | Average holding period (years) | No. of tnx |
| $105,578 | $1,014,260 | 10.41% | 7.5 | 67 | -$39,254 | $989,674 | -3.97% | 5.8 | 29 |
When we examine resale profitability, the difference between older freehold condos and newer 99-year leasehold projects in Hillview becomes clear.
The freehold developments – Hillview Park, Hillview Heights, and Glendale Park – recorded zero unprofitable transactions over this period and delivered exceptionally high average ROIs, with long-term owners holding for over 15 years.
In contrast, both The Hillier and Kingsford Hillview Peak saw a number of unprofitable sales. At Kingsford Hillview Peak, nearly one-third of the resale transactions (29 out of 96) resulted in a loss. While many owners still turned a profit, the average ROI among profitable sales was a modest 10.41 per cent, compared to -3.97 per cent for the unprofitable ones.
Notably, the average holding period for loss-making sellers was shorter: just 5.8 years versus 7.5 years for those who gained. This suggests that many of the loss-making owners may have bought during or after the developer’s price cuts (2015–2017), or were affected by the prolonged stagnation in the resale market.
It also lends credence to the old theory that, when you have leasehold projects among freehold ones, the leasehold condos can suffer more in comparison.
What about the performance of specific unit sizes?
By now, there’s no denying the weaker performance of the overall project; but sometimes certain unit sizes can buck the trend. So let’s go beyond the ROI of the overall condo, and look at returns based on unit sizes:
1-bedroom units
| Year | The Hillier | Kingsford Hillview Peak |
| 2020 | $1,351 | $1,265 |
| 2021 | $1,415 | $1,328 |
| 2022 | $1,473 | $1,370 |
| 2023 | $1,529 | $1,354 |
| 2024 | $1,539 | $1,463 |
| Annualised | 3.31% | 3.69% |
Here, Kingsford Hillview Peak actually outperformed The Hillier: a bright spot for this project. Its one-bedroom units saw a respectable 3.69 per cent growth. This is due to Kingsford Hillview’s lower overall quantum, making them more attractive to yield-focused investors and singles. We’ll examine this in detail below.
2-bedroom units
| Year | Hillview Park | Hillview Heights | Glendale Park | The Hillier | Kingsford Hillview Peak |
| 2020 | $1,191 | $1,240 | $1,247 | $1,353 | $1,313 |
| 2021 | $1,301 | $1,344 | $1,325 | $1,448 | $1,266 |
| 2022 | $1,610 | – | $1,423 | $1,519 | $1,352 |
| 2023 | – | $1,600 | $1,539 | $1,588 | $1,319 |
| 2024 | $1,597 | $1,678 | $1,669 | $1,674 | $1,459 |
| Annualised | 7.61% | 7.85% | 7.56% | 5.46% | 2.67% |
Across the board, Kingsford Hillview Peak’s two-bedders were the weakest performers. We will look into some of the potential reasons below, when we cover layouts below.
3-bedroom
| Year | Hillview Park | Hillview Heights | Glendale Park | Kingsford Hillview Peak |
| 2021 | $1,205 | $1,275 | $1,341 | $1,326 |
| 2022 | $1,371 | $1,475 | $1,478 | $1,438 |
| 2023 | $1,450 | $1,603 | $1,530 | $1,499 |
| 2024 | $1,448 | $1,760 | $1,619 | $1,351 |
| Annualised | 4.70% | 8.40% | 4.83% | 0.47% |
Note: There were no three-bedder transactions for Kingsford Hillview in 2020, so we will look only at 2021 to 2024.
This is where the gap becomes most pronounced. From 2021 to 2024, Kingsford Hillview Peak’s three-bedroom units grew by just 0.47 per cent annually, while Hillview Heights soared with 8.4 per cent growth. Larger-unit segments seem to be pulling down Kingsford Hillview, so we’ll review the reasons in the layouts below.
Next, let’s look at overall quantum and size compared to The Hillier.
This is also a major factor that could impact demand.
Average 1-bedroom prices

| Year | The Hillier | Kingsford Hillview Peak |
| 2020 | $818,900 | $685,333 |
| 2021 | $816,988 | $712,188 |
| 2022 | $827,841 | $736,039 |
| 2023 | $904,000 | $808,169 |
| 2024 | $894,757 | $802,455 |
Average 1-bedroom sizes (sqft)

| Year | The Hillier | Kingsford Hillview Peak |
| 2020 | 607 | 542 |
| 2021 | 579 | 538 |
| 2022 | 564 | 538 |
| 2023 | 593 | 613 |
| 2024 | 582 | 551 |
| Average | 585 | 556 |
While both projects offer relatively compact one-bedders, The Hillier commands higher prices. Kingsford’s lower quantum makes it more accessible, but this may be a sole defining advantage; it would explain the rather modest price gap narrowing only slightly over time.
Average 2-bedroom prices

| Year | Hillview Park | Hillview Heights | Glendale Park | The Hillier | Kingsford Hillview Peak |
| 2020 | $999,000 | $1,210,750 | $1,295,000 | $1,109,861 | $1,054,000 |
| 2021 | $1,148,000 | $1,315,000 | $1,412,398 | $1,182,900 | $1,089,654 |
| 2022 | $1,300,000 | $1,470,500 | $1,258,089 | $1,114,991 | |
| 2023 | $1,549,600 | $1,657,500 | $1,307,333 | $1,221,636 | |
| 2024 | $1,333,333 | $1,625,000 | $1,800,000 | $1,364,611 | $1,254,286 |
Average 2-bedroom sizes

| Year | Hillview Park | Hillview Heights | Glendale Park | The Hillier | Kingsford Hillview Peak |
| 2020 | 840 | 977 | 1039 | 821 | 802 |
| 2021 | 883 | 978 | 1068 | 817 | 869 |
| 2022 | 807 | 1033 | 829 | 826 | |
| 2023 | 969 | 1079 | 823 | 962 | |
| 2024 | 836 | 969 | 1084 | 815 | 870 |
| Average | 841 | 973 | 1061 | 821 | 866 |
Kingsford Hillview Peak’s two-bedroom units fall somewhere in the middle in terms of size, but not in value. Despite having reasonably sized layouts, they consistently recorded the lowest average prices among all five projects.
In contrast, Hillview Heights and Glendale Park are larger freehold units, which helps justify their higher price tags. Even The Hillier, with smaller average size, commanded higher pricing though; so we’ll look more into layout for that.
Average 3-bedroom prices
There were no 3-bedders sold in Kingsford Hillview Peak in 2020, so we will look at 2021 – 2024

| Year | Hillview Park | Hillview Heights | Glendale Park | Kingsford Hillview Peak |
| 2021 | $1,626,000 | $1,825,000 | $1,758,718 | $1,490,833 |
| 2022 | $1,690,000 | $1,951,000 | $1,990,727 | $1,540,000 |
| 2023 | $1,872,000 | $2,203,333 | $2,015,510 | $1,605,000 |
| 2024 | $1,924,000 | $2,520,000 | $2,103,014 | $1,731,857 |
Average 3-bedroom sizes

| Year | Hillview Park | Hillview Heights | Glendale Park | Kingsford Hillview Peak |
| 2021 | 1350 | 1432 | 1314 | 1130 |
| 2022 | 1232 | 1324 | 1353 | 1071 |
| 2023 | 1292 | 1374 | 1321 | 1071 |
| 2024 | 1329 | 1432 | 1304 | 1352 |
| Average | 1301 | 1390 | 1323 | 1156 |
From 2021 to 2024, Kingsford Hillview Peak consistently had the lowest average quantum for three-bedroom units among its peers. Size may give us a clue what’s happening: among the four, Kingsford Hillview Peak had the smallest 3-bedroom layouts, averaging just 1,156 sq ft compared to 1,300–1,390 sq ft in the freehold developments.
While this made Kingsford’s three-bedders the most affordable by quantum, it also translated into lower $PSF and weaker price appreciation; so again we need to look at layout to determine why.
Let’s take a look at some layout comparisons, between Kingsford Hillview Peak and its nearby equivalents.
We’ll begin with one-bedder comparisons with The Hillier:


Both projects offer a range of sizes and configurations for their one-bedroom units.
A key distinction, however, is that all one-bedders at The Hillier come with high ceilings and a built-in loft platform in the master bedroom, effectively creating a split-level layout. This allows the upper loft to function as a sleeping area, while the lower level can be used as a study, walk-in wardrobe, or additional lounge space.
Beyond this feature, the general layouts across both developments are fairly similar: open-concept kitchens, combined living and dining areas, balconies, etc.
Interestingly, this worked out in favour of Kingsford Hillview Peak. There are two reasons for this: first, Kingsford Hillview Peak and The Hillier are pre-GFA harmonisation projects. Features like double ceilings could result in paying for strata void space, which made these seem wasteful.
Second, investors may frown on The Hillier’s features, which raise costs without reliably raising rentability. Tenants are often more interested in fundamentals like proximity to work, cost, public transport, etc., and are less emphatic about aesthetic elements like double-ceilings. So in this instance, the simple lower quantum of Kingsford Hillview works to its advantage.
Now let’s look at the two-bedder units:
Both projects offer a range of two-bedroom, two-bathroom unit layouts in various sizes.
While the two selected layouts are quite similar in terms of overall square footage, their internal configurations differ in several key ways.


At Kingsford Hillview Peak, the balcony is larger, stretching from the living room to the common bedroom. In contrast, Hillview Park features a smaller, more compact balcony. This might work against Kingsford Hillview, as more buyers today think balconies are wasted spaces.
The living and dining areas at Kingsford Hillview Peak follow an open-plan layout without clear separation, while Hillview Park provides more definition between the two spaces; this is generally preferred for zoning and furnishing (although it’s nothing good interior design can’t rectify)
In terms of kitchen design, Kingsford Hillview Peak comes with an open-concept kitchen. This is more modern in feel, but with fewer storage and ventilation options. Hillview Park, on the other hand, features an enclosed kitchen with a small yard, offering better separation for cooking activities and a practical area for laundry or storage. This is definitely more of an advantage for Hillview Park in general.
Both units have comfortably sized bedrooms that can accommodate double beds, with particularly spacious master bedrooms. Hillview Park’s master bathroom stands out thanks to its larger size and inclusion of a bathtub, a rare luxury in newer layouts. It also features a dedicated storeroom, providing additional space to stow away bulky or infrequently used items. Overall though, we would tilt the scales toward Hillview Park, especially in light of more recent buyer preferences.
Now let’s look at the three-bedder units:
Both projects offer three-bedroom units in a range of sizes and layouts. When comparing the smallest three-bedroom options, Hillview Park’s units are noticeably larger than those at Kingsford Hillview Peak.


To be frank, we don’t consider either of the layouts here to be ideal. Some may like the old-school method of dividing social spaces from bedrooms, but in both cases it results in a long and wasteful corridor space.
Nonetheless, Kingsford Hillview Peak again features a large balcony, stretching from the living room to one of the common bedrooms. Again, this could make Hillview Park preferable, with less space wasted on a smaller and more conventional balcony.
Hillview Park also includes a dedicated storeroom, a master bathroom with a bathtub, and a separate yard area. Notably, it has a secondary entrance that opens directly into the kitchen. This is a practical feature commonly found in older developments, and is even more useful today due to grocery and food deliveries (e.g., if you’re ordering your food or groceries online, you don’t need to lug them from your front door all the way to the fridge; just get them from the kitchen entrance.)
This does significantly favour Hillview Park for three-bedders, given current buyer predilections.
Overall conclusion:
At first glance, Kingsford Hillview Peak looks like a project with strong fundamentals: proximity to MRT, full facilities, and affordable quantum; particularly for one-bedders. Yet more than a decade after launch, it lags significantly behind its peers in terms of both annualised growth and resale profitability.
While some of this can be attributed to early developer pricing missteps – and the timing of its launch amid cooling measures – the project’s slower performance persisted even in the resale market. This was long after the initial price cuts were over. In this case, ROI tells us a little bit of what happened, but not why.
Kingsford Hillview Peak’s performance is influenced by multiple qualitative factors: from perceived build quality and media coverage, to its proximity with nearby freehold alternatives. Certain elements like large balcony space, open-concept kitchens, and corridor-heavy layouts may have been more acceptable (or in some cases even preferred) in the previous decade, but are less desirable today.
The ROI alone also doesn’t reveal certain elements – for example, the one-bedders here have performed reasonably well, and some buyers will appreciate the lower quantum. If you look only at the ROI, you may not notice that the one-bedders here are under $800,000; which is not bad for a high-ceiling unit that’s within a five-minute walk to Hillview MRT (for owner-occupiers, if not for landlords.)
There’s also a degree of subjectivity we need to acknowledge
We’d also note that, for owner-occupiers with contrary tastes – such as those who love big balconies and the incorporation of outdoor spaces – a sole focus on ROI may cause you to miss Kingsford Hillview Peak’s layouts.
It also has to be considered that, by this point in its history, prior problems such as the finishing of the units have either been long rectified by the developers’ defect correction or else handled by subsequent renovations. For buyers willing to focus on fundamental realities – like good proximity to the MRT and good unit sizes – the ROI and past complaints may not matter.
For the next part of our study, join us on Stacked Pro as we look at Forest Woods and Rivergate, to see what ROI doesn’t fully reveal about condo projects.